Skip to content

The digital twin for tropical orchards

Every tree. Tagged, tracked, predicted.

CanopyTwin turns tropical and rare-fruit orchards into living digital twins — every tree QR-tagged on a satellite map, every survey photo counted by AI, every microclimate measured at your exact coordinates.

Every number and photo below comes from a single 243-photo survey of a working durian orchard — the same dataset behind the live demo.

The digital twin

One map that knows every tree

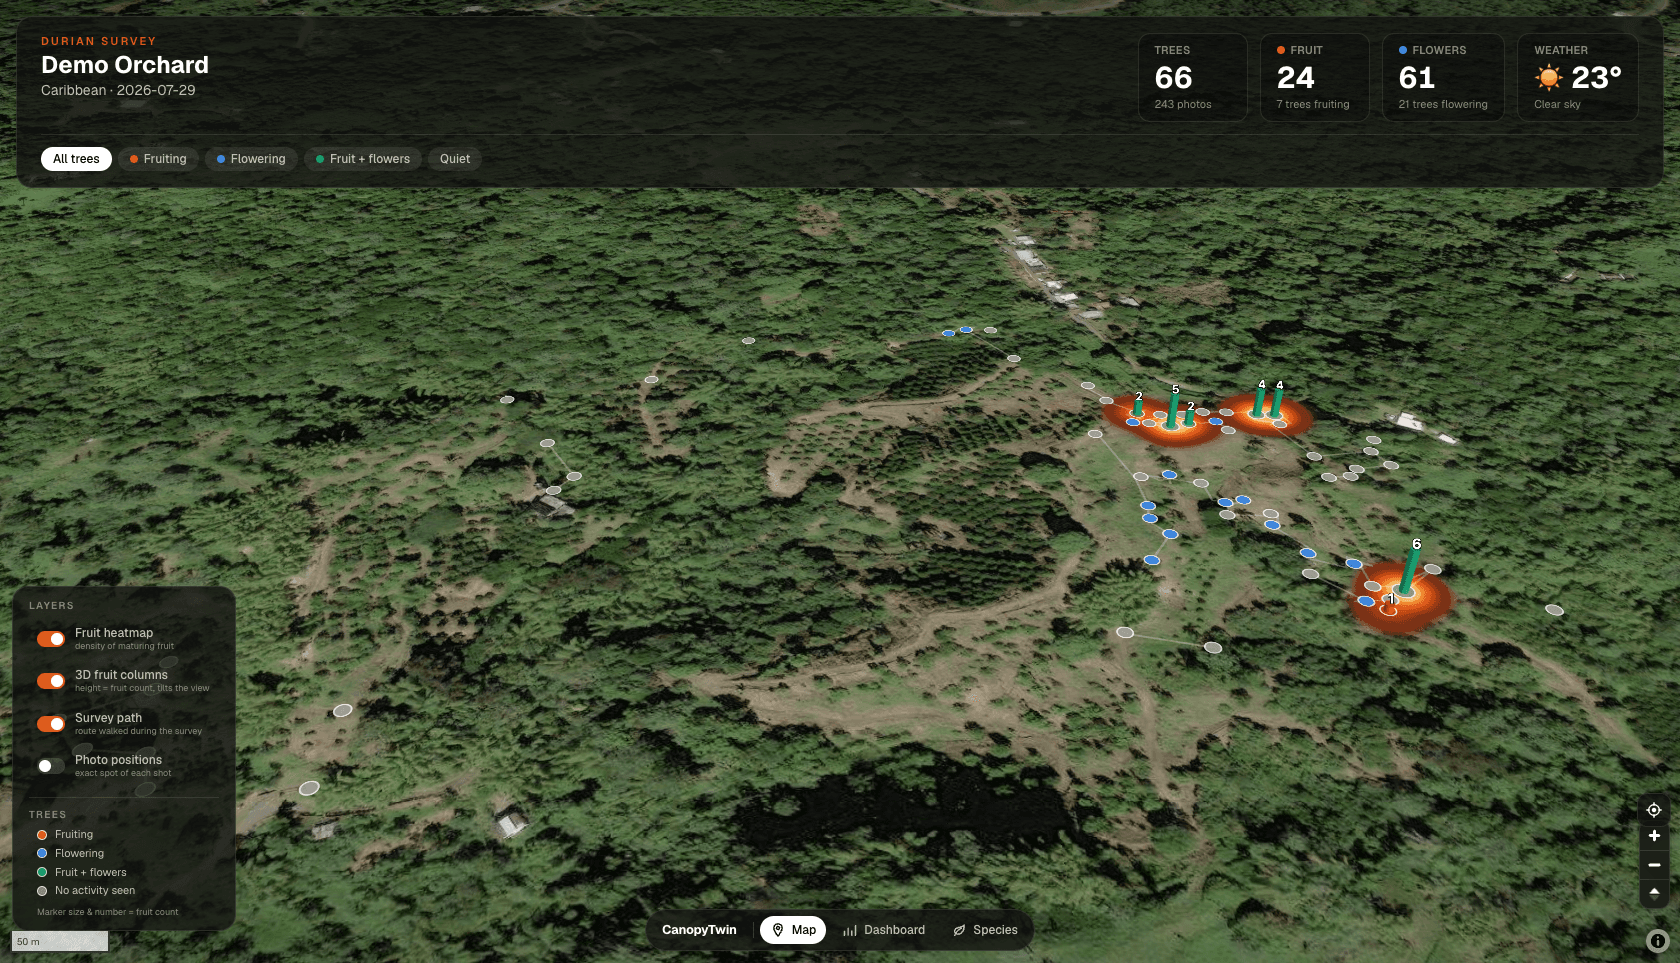
Markers for every tagged tree, heatmaps of maturing fruit, 3D count columns, and the exact path your surveyor walked — over live satellite imagery of your own land.

Satellite digital twin of a durian orchard with tree markers, a fruit heatmap, and 3D fruit-count columns
The actual demo farm with the fruit heatmap and 3D columns switched on. Open it live

Field proof

Straight from the survey camera roll

Unstaged photos from the demo farm's tagging walk — each one geotagged, matched to its tree, and counted by AI.

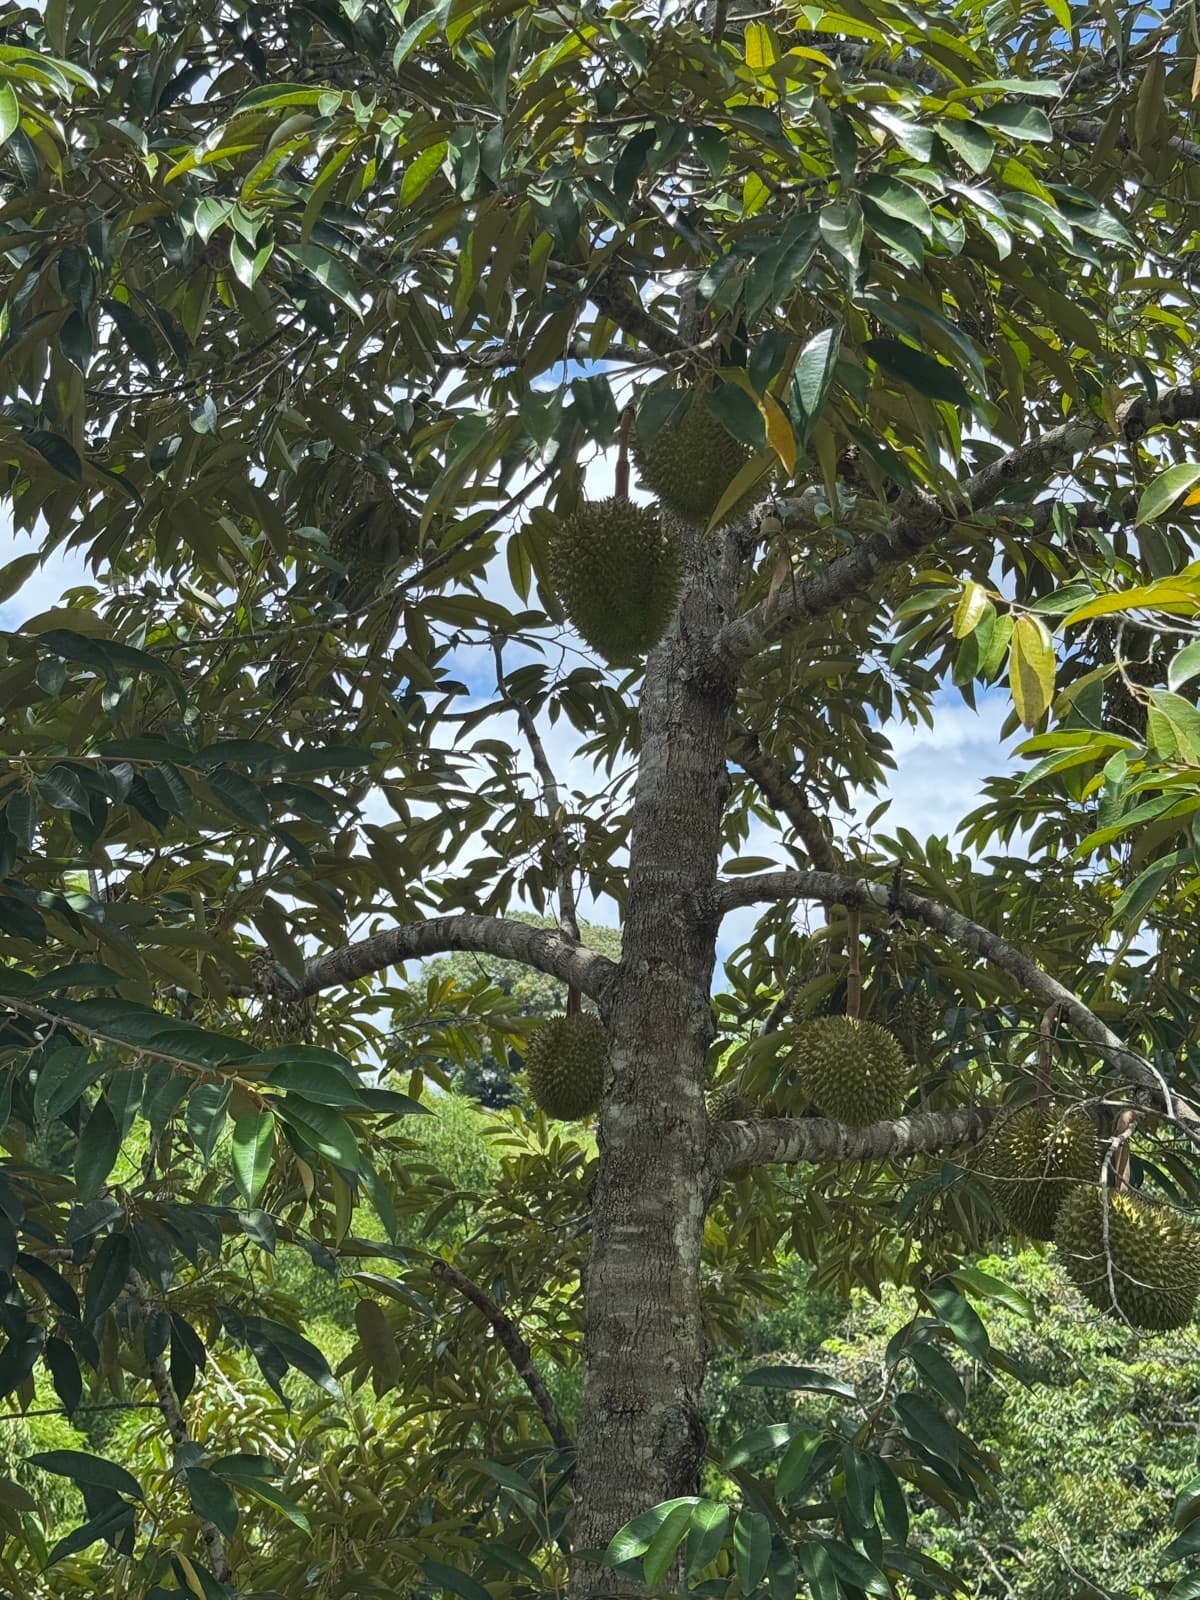
Looking up a durian trunk into the canopy, with six spiky fruit clustered along the branches
AI count: 6 fruit · high confidence
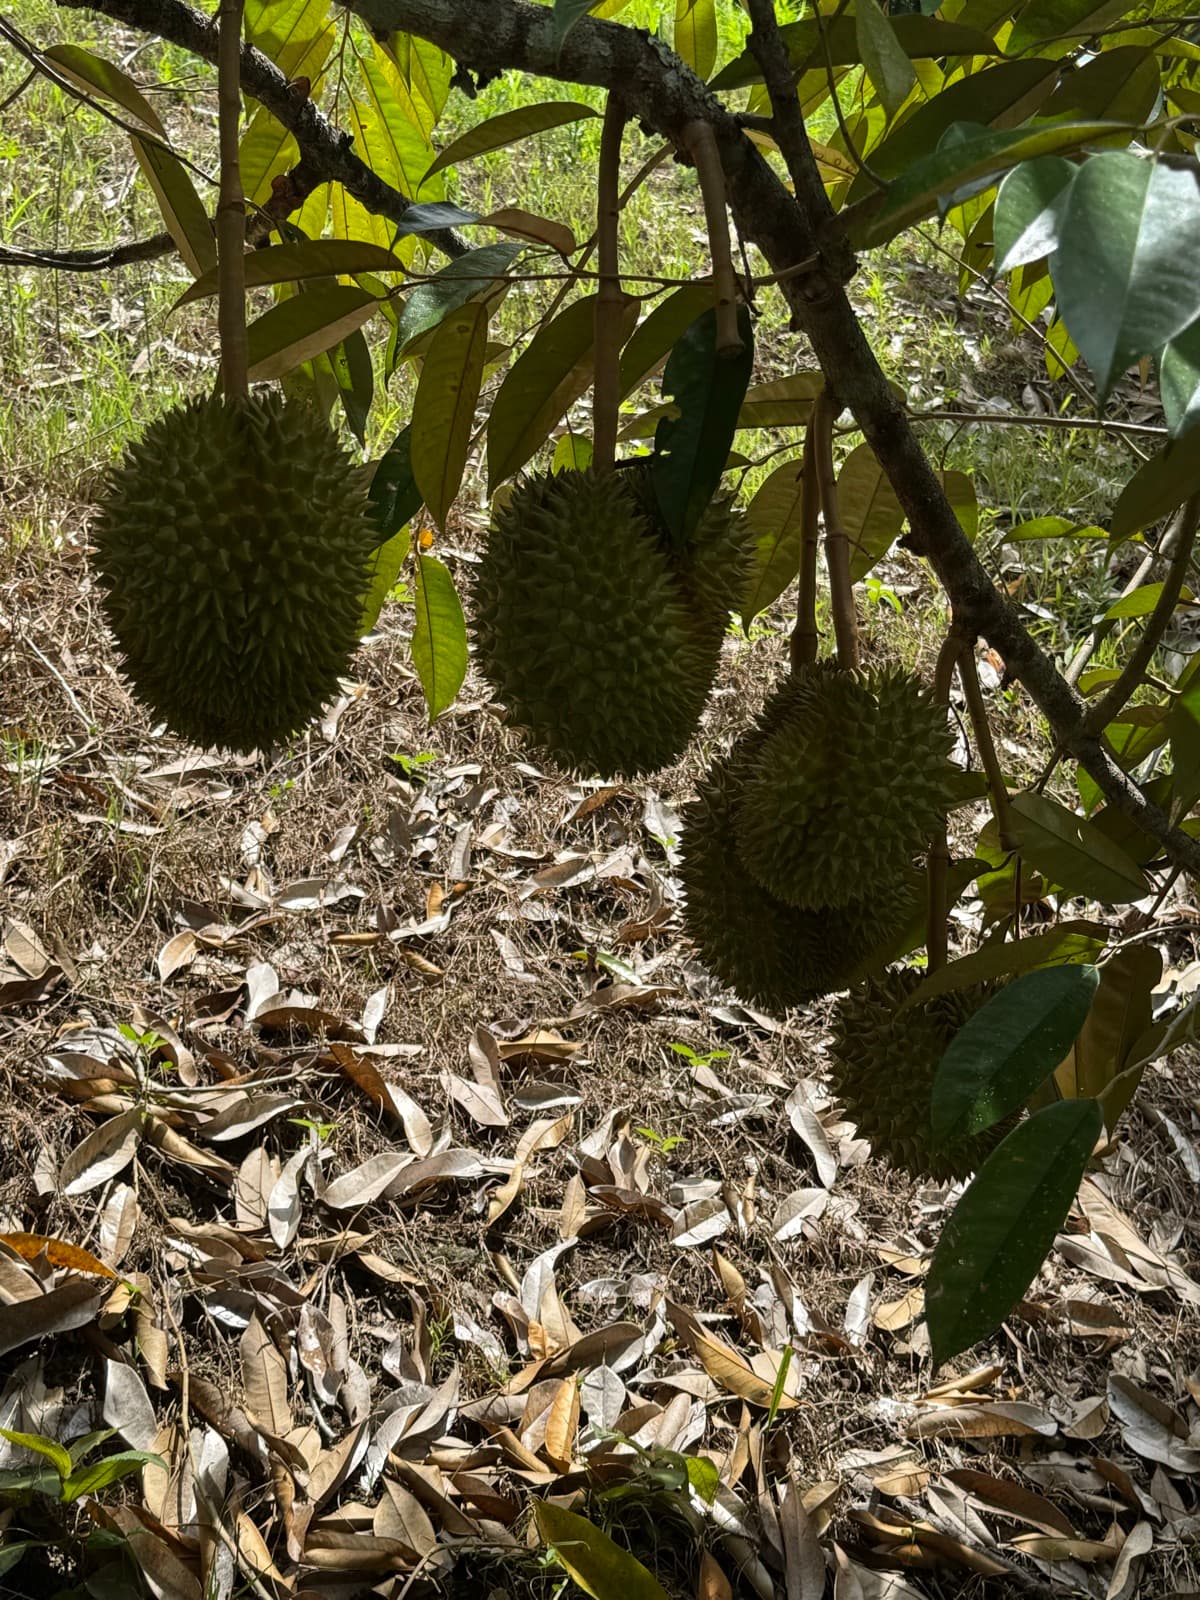
Four spiky durian fruit hanging from a low branch in dappled light
AI count: 4 fruit · high confidence
Three durians hanging together above a horizontal limb, flower buds on a branch nearby
AI count: 3 fruit + 1 flower cluster · high confidence
Durian branches loaded with round green flower-bud clusters against the sky
AI count: 8 flower clusters · medium confidence
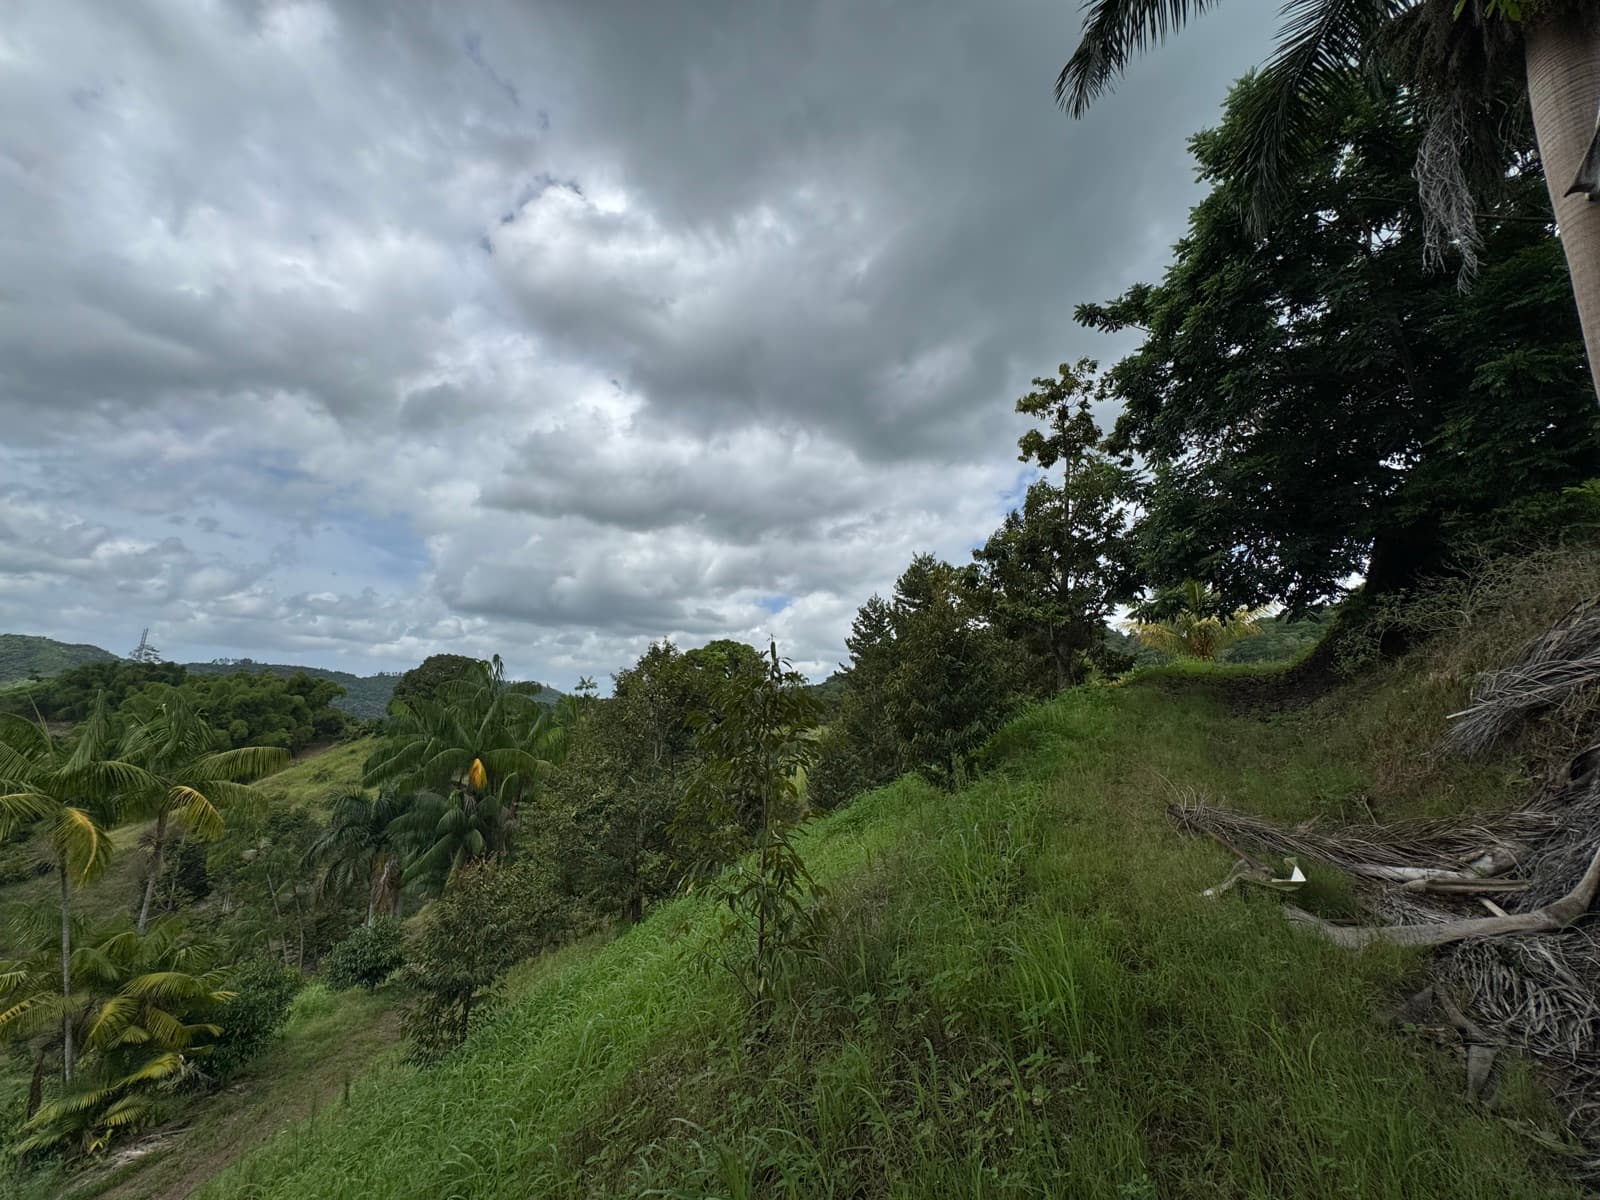
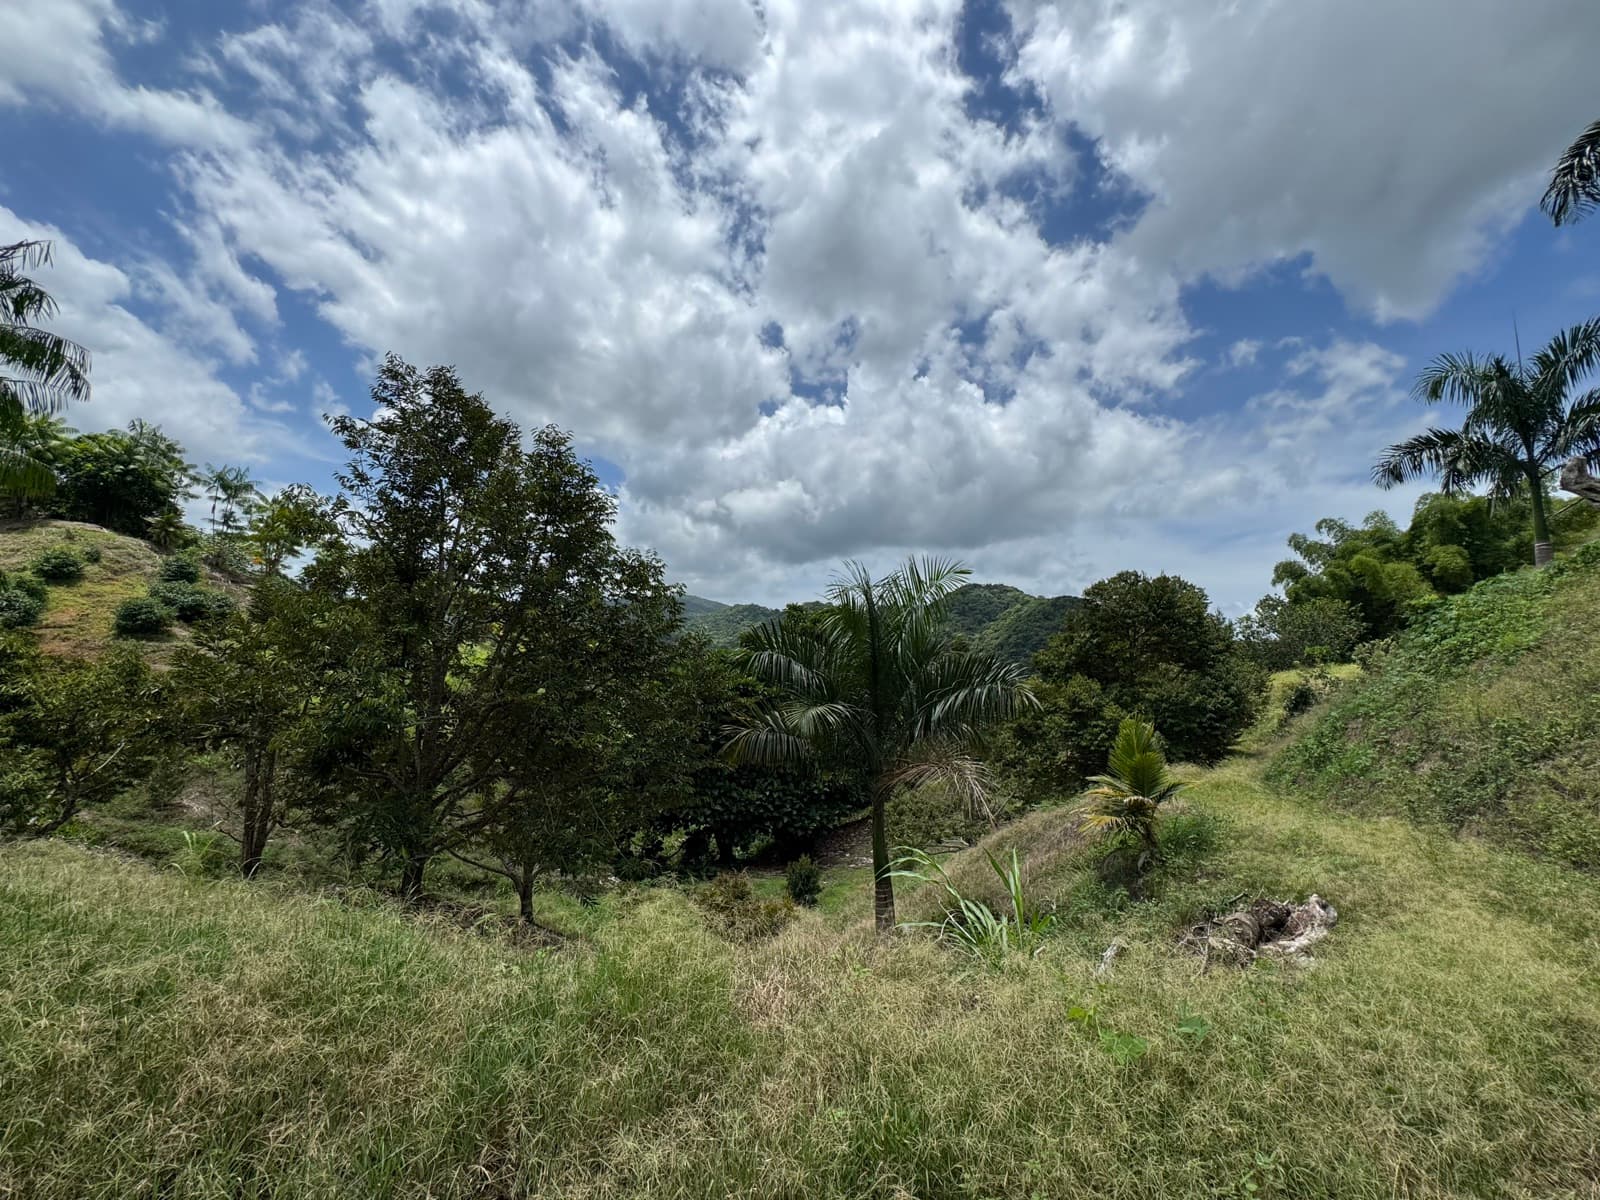
Grassy hillside with palms and fruit trees under a cloudy sky at Demo Orchard
Demo Orchard · CaribbeanThe demo farm, from the ground
Open pasture rising into palms and mixed fruit trees under a bright tropical sky
Walking the July 2026 surveyOne phone, one afternoon

How it works

From notebook to digital twin in one afternoon

No new hardware required to start — a roll of QR tags and the phone already in your pocket digitize the first block.

  1. 01

    Tag every tree

    Zip-tie a weatherproof QR code to each trunk. One scan in the field opens that tree — its species, cultivar, photos, and full history.

  2. 02

    Walk or fly a survey

    Photograph the canopy with the phone in your pocket, or fly a drone over the blocks. Geotags match every shot to its tree automatically.

  3. 03

    AI counts the crop

    Vision models count fruit and flower clusters in every photo, per tree, with a confidence score you can audit photo by photo.

  4. 04

    Your twin comes alive

    The orchard becomes a living digital twin — satellite map, per-tree history, and harvest forecasts that sharpen with every survey.

Everything in the box

Built for orchards, not spreadsheets

Every feature exists because a real survey needed it — from the tag on the trunk to the forecast on the dashboard.

  • QR-tagged physical inventory

    UV-stable tags give every tree a permanent identity. Scan at the trunk with any phone camera to open its record — no app to install.

  • AI fruit & flower counting

    Every survey photo is counted per tree — fruit, flower clusters, confidence score — and deduplicated across overlapping shots.

  • Interactive satellite twin

    A live satellite map of your orchard: tree markers, fruit heatmaps, 3D count columns, survey paths, and photo positions.

  • GPS-precise weather & soil

    Temperature, humidity, soil moisture, and ET₀ for your exact coordinates — your ridge line, not the nearest airport.

  • Sensor-mesh ready

    Data models built for field hardware from day one. Add soil probes and a gateway when you are ready — readings land per tree.

  • Drone photography pipeline

    Fly the blocks, drop in the card. EXIF GPS clusters shots to trees, the AI counts, and the twin updates — no manual sorting.

  • Predictive harvest modeling

    Counts plus species seasonality become per-block harvest outlooks, so labor and buyers are booked before the drop.

  • Multi-farm & team access

    Organizations, roles, and multiple farms under one roof — agronomist, foreman, and farm stand all see the same tree.

  • CSV & API export

    Your data stays yours. Export the full inventory and counts as CSV, or pull them through the API into your own tools.

Who it's for

From backyard collections to plantation blocks

Collectors & nurseries — US

Fifty species on five acres, and every one has a story

Your orchard holds more diversity than most botanical gardens — grafted seedlings, one-of-a-kind cultivars, trees with provenance worth protecting. CanopyTwin remembers what the notebook forgets.

  • QR tags turn farm tours and plant sales into self-guided experiences
  • Cultivar, graft, and planting history pinned to every tree
  • Species database with fruiting windows for tropical & rare fruit
  • First flowers and first fruit, spotted by AI before you walk past them

Commercial growers — US & Asia

Count the crop before the crew walks the rows

Manual fruit counts are slow, subjective, and weeks stale by the time they reach a spreadsheet. Replace them with drone or walking surveys that are counted overnight and mapped per block.

  • Per-block yield outlooks from AI counts + species seasonality
  • Drone pipeline: fly, upload, and the twin updates itself
  • Teams, roles, and multiple farms in one organization
  • CSV & API export straight into your packhouse or ERP systems

Free field guide

The Tropical Orchard Digitization Guide

The practical playbook from digitizing a working durian farm — from printing the first QR tag to reading your first AI fruit count. Written for growers, not developers.

Get the free guide

Read it online right after you sign up. No card, no trial, no spam.

  • A tag layout and numbering scheme that survives replanting
  • Survey-walk patterns that scale from a backyard collection to hundreds of trees
  • Phone and drone camera settings for countable canopy photos
  • How AI counting works — and how to audit its confidence

Put your whole orchard on one living map

Walk the demo farm first — 66 durian trees in the Caribbean — then start tagging your own.